[updated March 2025]
For Commercial and Private Use
Please Credit: Allied Payments

Global eCommerce Statistics
Total Retail e-Commerce Sales Worldwide
In 2023, retail e-commerce sales totaled approximately $5.8 trillion [USD] worldwide. This figure is expected to grow by 39% over the next years, surpassing $8 trillion [USD] by 2027. These numbers include all online orders, including mobile and desktop sales, except travel and some entertainment categories.
World Leaders
The Chinese retailer Alibaba maintains the position as largest e-commerce retailer globally with a 23% market share. Forecasts suggest that Amazon will surpass Alibaba with $1.2 trillion [USD] in sales by 2027.
Leading Online Retail Countries
China had the largest market in 2023 as internet sales accounted for nearly 50% of the country’s retail transactions. Indonesia ranked second with 32% of retail sales occurring online, followed by the United Kingdom and South Korea, both with online transactions exceeding 30% of total sales. Projections point to the Asian nations of the Philippines and India as the emerging e-commerce markets with growth rates expected to surpass 20%.

Notes:
* Worldwide; 2014-2027.
Percentage of e-Commerce Sales to Total Sales
Online sales have had an increasingly significant role on the retail industry. In 2023, over 19% of retail sales worldwide were ecommerce. Projections indicate that by 2027, about 25% of total retail sales worldwide will be made online.
Retail e-commerce
The popularity of online shopping has increased consistently in recent years. In 2021, online retail sales worldwide accounted for almost $5 trillion [USD] and is expected to surpass $7 trillion [USD] by 2025. The adoption in Latin America of ecommerce took off during the COVID-19 pandemic, with Argentina and Brazil becoming some of the global leaders of online retail market growth. As access to internet becomes cheaper and widely available through mobile providers, these countries have been able to tackle the constraints of financial and infrastructure limitations that hindered fixed broadband.
Mobile commerce
While the average order value from mobile shopping is still catching up to desktops, online retailers have closed the gap with ecommerce sales. Online shopping in Asia is the preferred method. Leading the way is Malaysia with about 45% of the population having made having purchased something by phone in 2021. Other strong Asian markets include South Korea, Taiwan, and the Philippines with some of the worlds highest ecommerce rates.
Notes:
* Worldwide; 2021-2027.
Annual Retail eCommerce Sales Growth
In 2022, e-commerce sales grew 6.5% globally over 2021. During that period, e-commerce accounted for approximately 19% of worldwide retail sales.
Asian countries at the Forefront
Projections rank China and Korea in the top three of countries with the greatest percentage of retail sales to occur online in 2022. Keeping with the theme, projections name the four fastest-growing retail e-commerce economies in the world as in Asia.
Amazon Leading the Way
With about 5.7 billion visits per month, Amazon is not only the most visited marketplace but also the leader with a market cap above $1 trillion [USD].

Notes:
* Worldwide; 2017-2027.
Average eCommerce Revenue per User

Notes:
* Regional. Worldwide; 2022.
Total Retail eCommerce Revenue
Asian eCommerce Market Dominance
Asia ranks as the biggest e-commerce markets globally with revenues of roughly $1.7 trillion [USD] in 2023 as China lead the way with over $935 billion [USD] in revenues. The Asian market’s revenue was nearly 35% greater, $800 billion [USD], than the America market of $1.1 trillion [USD].
Asia’s Predominance in e-Commerce
eCommerce is well established and highly developed throughout Asia and will continue to grow, and will continue to grow. India has one of the highest eCommerce Compound Annual Growth Rate (CAGR) markets with an expected 14% annual growth rate between 2023 and 2027. Similar growth rates are also expected in the Latin-American e-commerce market over the next few years. The larger Asian e-commerce markets influence other markets around the work, such as the TikTok Shop, who is leading the way in social commerce by connecting social media and e-commerce.

Notes:
* Worldwide; 2023.
Leading Countries by Retail eCommerce Sales Growth
Fast Growing Retail eCommerce Countries
2023 eCommerce forecasts point to significant growth in Asia and the Americas with Mexico and the Philippines expected to be the sector leaders. Estimates poised for a surge of approximately 25 percent and 24 percent in online sales, respectively. Following closely behind, Malaysia secures the third spot with an 18 percent growth rate. Meanwhile, Argentina and Brazil were expected to outpace other nations, with e-retail sales forecast to grow by over 15 percent.
Growing Global e-Retail Market
Partly fueled by a rapid increase in internet users worldwide over recent years, along with mobility constraints and the shutdown of physical stores during the COVID-19 pandemic, the global e-commerce retail market expanded fourfold from 2014 to 2022. Central to this growth has been the widespread adoption of mobile commerce, which entails online shopping through smartphones, particularly prominent in various regions of the global South. Forecasts suggested that m-commerce sales in Argentina are poised to surge by around 2.4 times between 2022 and 2026.
Local Players Fueling Fast Growth
While online retail giants Amazon and Alibaba Group wield global dominance in the e-commerce landscape, they do not hold the top positions in many of the fastest-growing e-commerce markets. Based on monthly website traffic, Singaporean e-retailer Shopee is the leading e-commerce site in Singapore by a significant margin. This trend is even more pronounced in Argentina, where Mercado Libre garners nearly 50 times the traffic witnessed on Amazon’s Spanish page, amazon.es.

Notes:
* Worldwide; 2017-2027.
Market Cap of the Largest Online Service Companies
With a market of about $857 billion [USD] in December 2022, Amazon remains the largest consumer internet and online services company globally. Amazon ranks first among online companies operating in various sectors including retail, hospitality, travel, and real estate. With a market cap of $233 billion [USD], Alibaba ranks second globally.

Notes:
* Worldwide; 2023
* Amazon is the largest consumer internet and online service company worldwide with a market cap of approx. $857 billion [USD] as of December 2022. Amazon ranked first among selected online companies operating in the retail, hospitality, mobility, real estate, and travel sectors. Alibaba.com, the digital commerce platform, ranked second with a market cap of $233 billion [USD].

US eCommerce Statistics
Retail e-Commerce Sales in the USA
In 2022, retail e-commerce (including digital services) sales are set to surpass $1 trillion [USD]. Sales are forecasted to continue to grow after 2022 and regularly surpassing the $1 trillion [USD] mark through 2027.

Notes:
* United States; 2014 to 2025; forecasted data from October 2023.
* In 2022, US retail e-commerce sales are reported to have increased 16% to $1 trillion [USD] from $919 billion [USD]. After 2022, sales are projected to continue double-digit growth, though a possible decline in the growth rate within the next few years.
e-Commerce Industry Revenue in the USA
eCommerce revenues in the United States are expected to increase consistently between 2023 and 2028 by $619.7 billion [USD] or +67.75%. Revenues are estimated to hit a new high mark and surpass $1.5 trillion [USD] in 2028.
Notes:
* United States; 2019 to 2029
* eCommerce market revenues in the United States are forecasted to increase by $509.4 billion [USD] (54.19% ) from 2023 to 2027. Revenue is expected to reach $1.8 trillion [USD] by 2028.
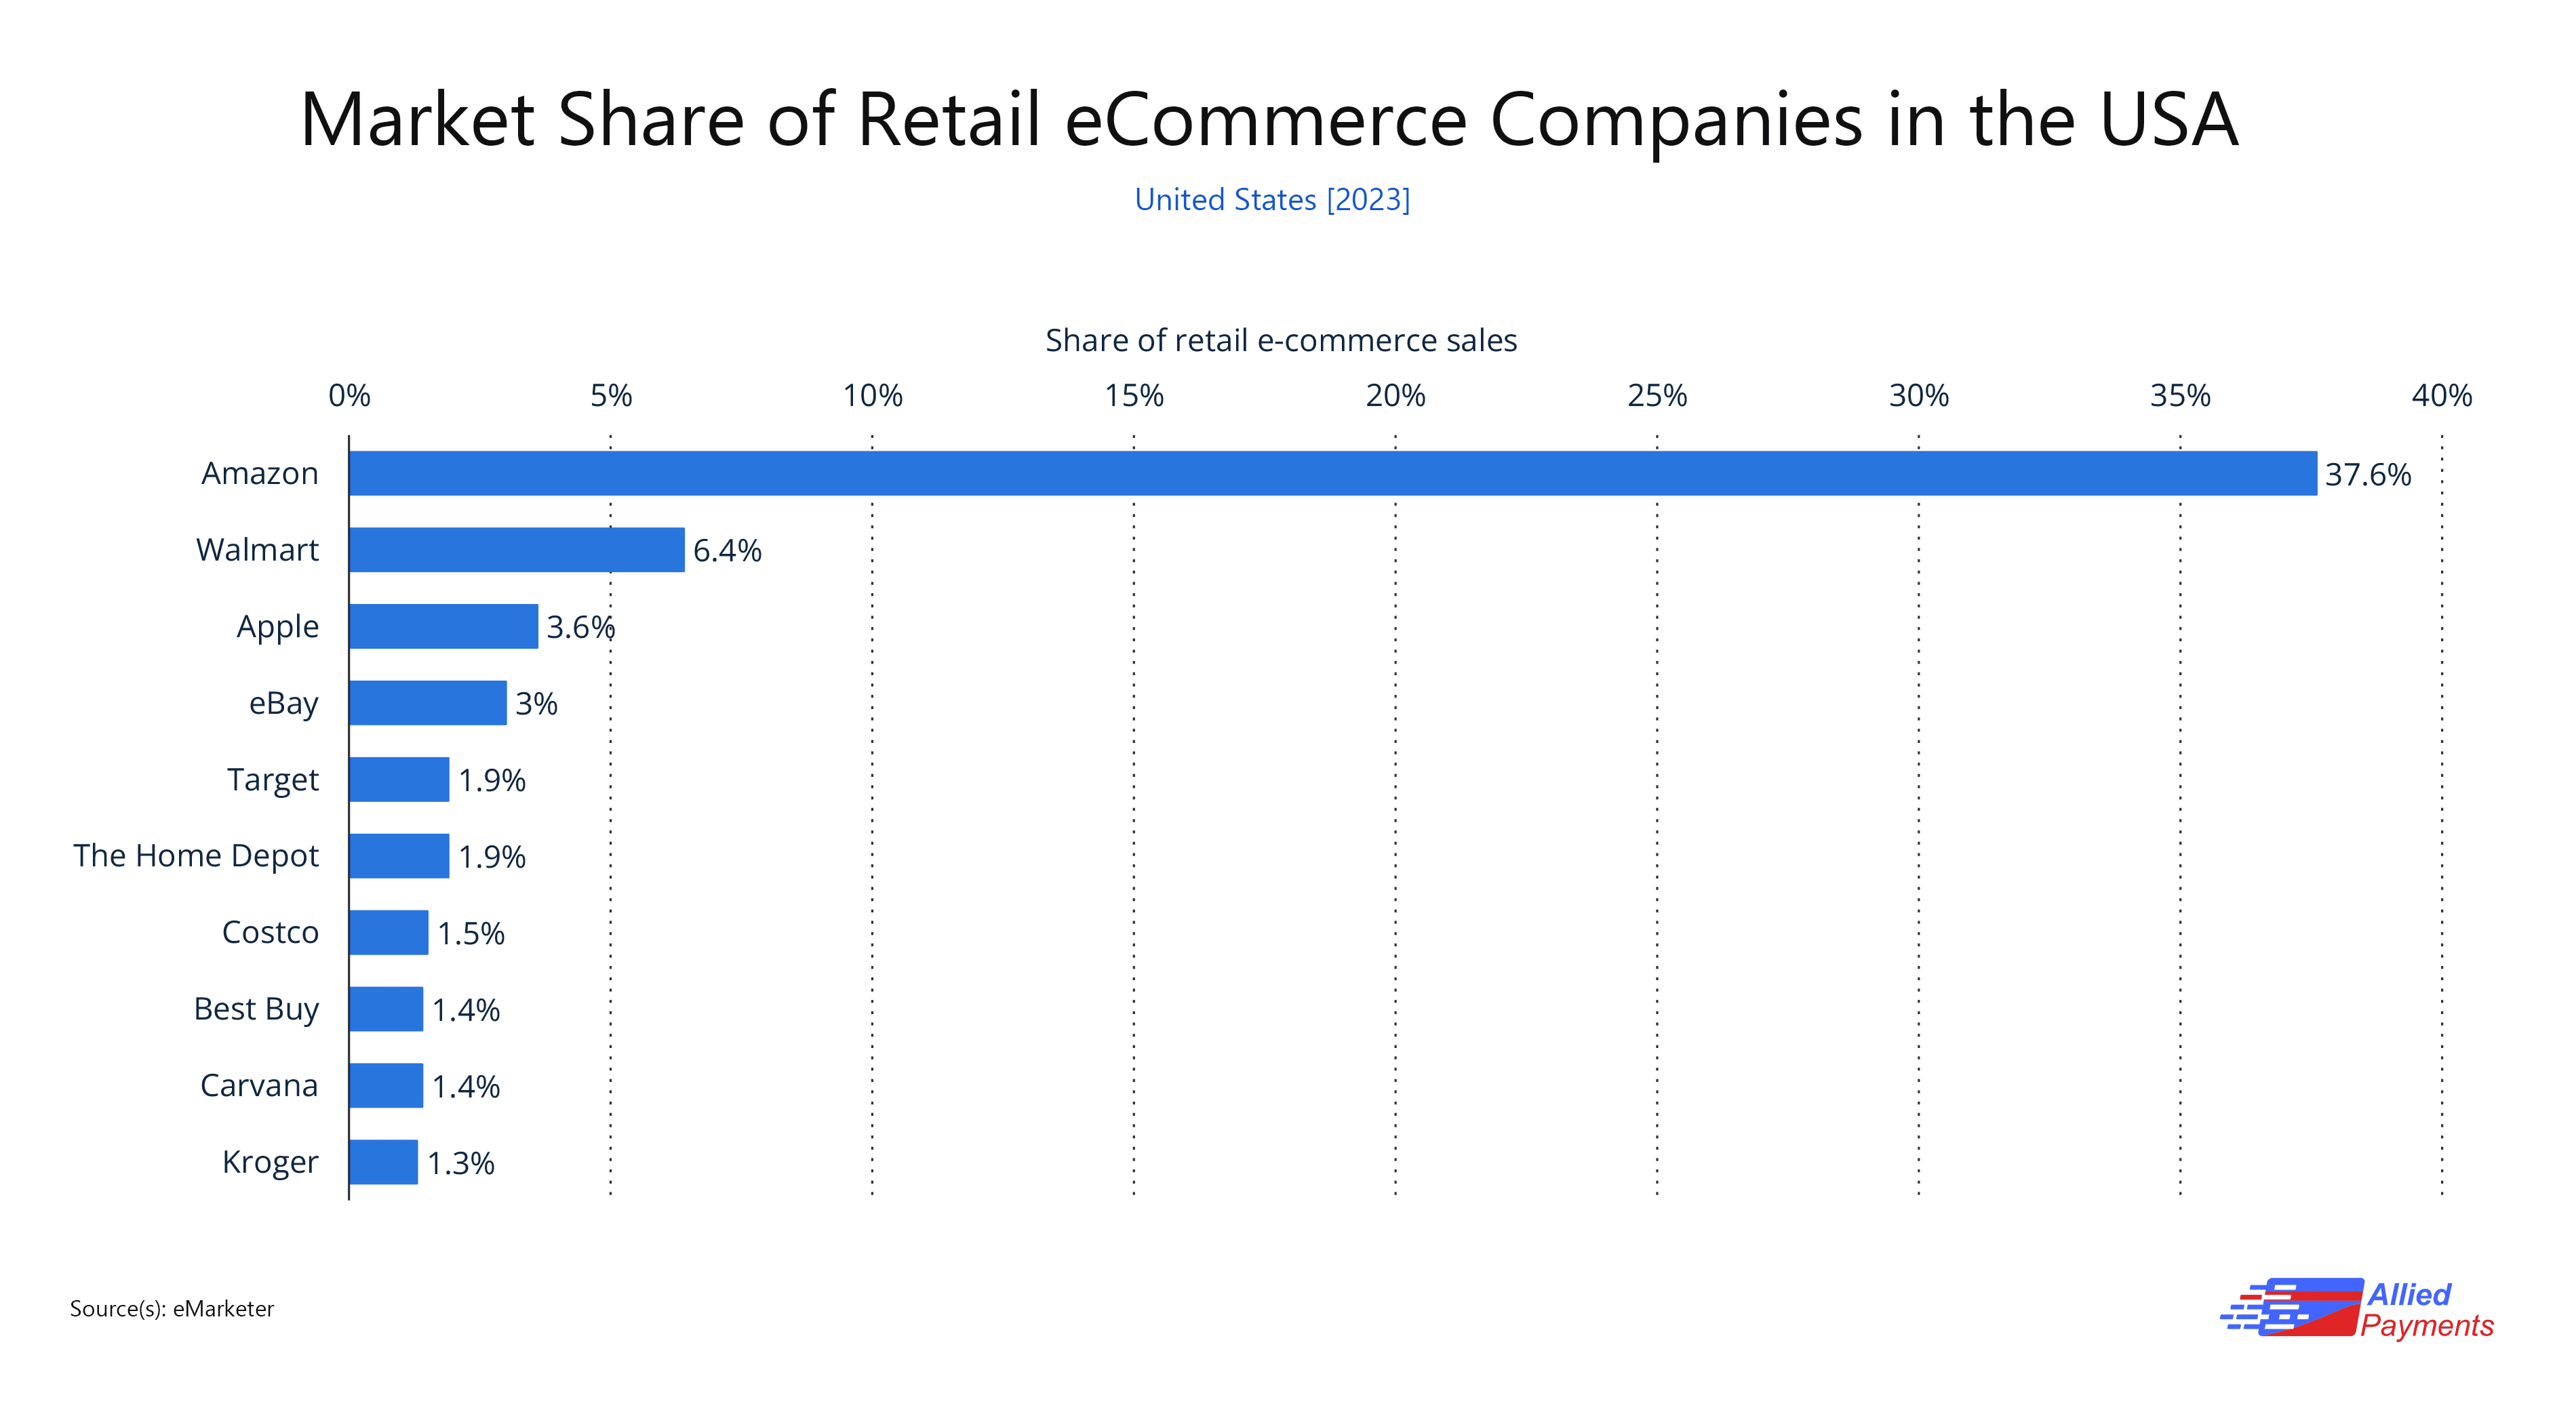
Market Share of Retail eCommerce Companies in the USA
2023 estimates place Amazon as the top online retailer in the US with 37.6% of the market. Walmart was second with 6.4% and Apple with 3.6%.
Amazon’s Success
In 2022, Amazon surpassed the $500 billion [USD] mark for net sales, with over $356 billion [USD] from sales inside the US. Germany was the second largest market with $33 billion [USD] and third was the UK with $30 billion [USD].
Growth in Online Shopping
In 2023, US e-commerce was worth almost $1 trillion [USD] and 2027 estimates expect it to grow more than 50%.
Market share of Retail eCommerce in the USA in 2023
Notes:
* June 2022; United States
* According to estimates, Amazon will capture 37.6% of the United States market among online retailers in 2023. Walmart will be second with a 6.4% market share followed by Apple with 3.6% market share.
* In 2022, Amazon hit over half a trillion U.S. dollars in net sales. The United States is by far Amazon’s most profitable market with sales over $356 billion [USD] in 2022. Germany ranked second with $33 billion [USD] followed by the United Kingdom with $30 billion [USD].
* The U.S. e-commerce industry was worth almost $1 trillion [USD] in 2023. 2027 forecasts show that online shopping will grow more than 50%. U.S. online shoppers purchase fashion, food, and beverages the most via the internet.
Number of eCommerce Users in the USA
The number of e-commerce users in the US is forecasted to continue increasing by 59.8 million (+25.11%) between 2023 and 2028 to hit a record high of 297.1 million users.

Notes:
* 2018-2027; United States
* Between 2023-2027, the total number of users in the US E-commerce market is forecast to continuously increase by 15.2 million users (+5.53%) to a new peak of 289.7 million users in 2027.
eCommerce Penetration Rate in the USA
The eCommerce penetration rate in the USA is forecasted to continuously increase by 12.8% between 2023 and 2028. After nine consecutive years of growth, eCommerce is estimated to reach over 97% of people in the USA by 2029.

Notes:
* 2020-2029; United States. Based on active paying customers.
* The eCommerce market penetration rate in the United States is forecast to annually increase between 2025 and 2029 by more than 2% annualy. After the ninth consecutive year of increases, the indicator is estimated to reach a new peak of 97.09% in 2029.
eCommerce Sales Compound Annual Growth Rate [CAGR] in the USA
The Compound Annual Growth Rate (CAGR) of the most common e-commerce categories in the United States averaged 12.7% between 2017 and 2027. The Food industry has the highest CAGR, with an estimated 24% growth rate between 2017 and 2027. Media is expected to register the lowest CAGR at just under 7% during the 2017 to 2027 period.

Notes:
* November 2022, United States.
* The compound annual growth rate (CAGR) of e-commerce categories in the United States is projected to be +12.7% between 2017 and 2027. The highest CAGR for this period was estimated to be in the food segment, amounting to +24%. The segment of beauty, health, personal & household care is estimated to have over 14% compound annual growth rate from 2017-2027.

Retail Industry Statistics
Largest eCommerce Retailers by Sales
(2022; 2027)
As of 2022, the Alibaba Group was the largest e-commerce retailer worldwide with estimated annual online sales of $780 billion [USD]. During the same period, Amazon was the second-largest e-commerce retailer with online sales estimated at $690 billion [USD]. Forecasts do show Amazon taking the top spot in 2027 with online sales exceeding $1.2 trillion [USD].
Location Makes All The Difference
Alibaba primarily operates within China, home to the largest population and one of the highest penetrations of e-commerce in the world. Amazon does not have a large presence in China but operates in various large e-commerce markets around the world.
Global Growth of e-Commerce
Online sales have consistently been a significant portion of global retail sales. Between 2017 and 2022, the share of e-commerce sales to total retail sales nearly doubled. This has not been the case for every country, with markets like the Philippines, Brazil, and Argentina growing substantially more while other markets like the US and China have grown, but at a slower rate.

Notes:
* May 2022; Worldwide.
* Since 2022, Alibaba Group has been the largest e-commerce retailer worldwide with an estimated $780 billion [USD] in annual online sales. Amazon is second with approximately $690 billion [USD] in online sales. Projections forecast that Amazon will overtake Alibaba by 2027 with estimated annual online sales exceeding $1.2 trillion [USD].
* Alibaba Group operates predominantly in China, taking advantage of one of the highest rates of e-commerce adoption in the world. Amazon has operations throughout the world, allowing for global growth.
* Online sales have become an increasingly significant part of global retailing. The ecommerce share of total global retail sales nearly doubled between 2017 and 2022 with fast-growing markets in South America projected to grow faster than mature markets.
Most Visited Online Retail Websites
(2022)
Online retailers and websites made significant gains during COVID-19 due to widespread shelter-in-place orders which resulted in the spike in e-commerce traffic. The effects have been long-lasting. In 2022, Amazon.com had monthly traffic of nearly 3.2 billion visitors followed by eBay.com with nearly 590 million website visits each month.

Notes:
* January to May 2022, Worldwide.
Most Popular Online Shops in the USA
(March 2023)
In a 2023 survey conducted with 10,022 consumers in the United States and asked about the “Most Popular Online Shops”. Amazon was the most popular answer followed by Walmart.com and Target.com.

Notes:
* April 2022 to March 2023.
* Results are based on a representative online survey conducted in 2023 among 10,012 consumers aged 18-64 years in the United States.
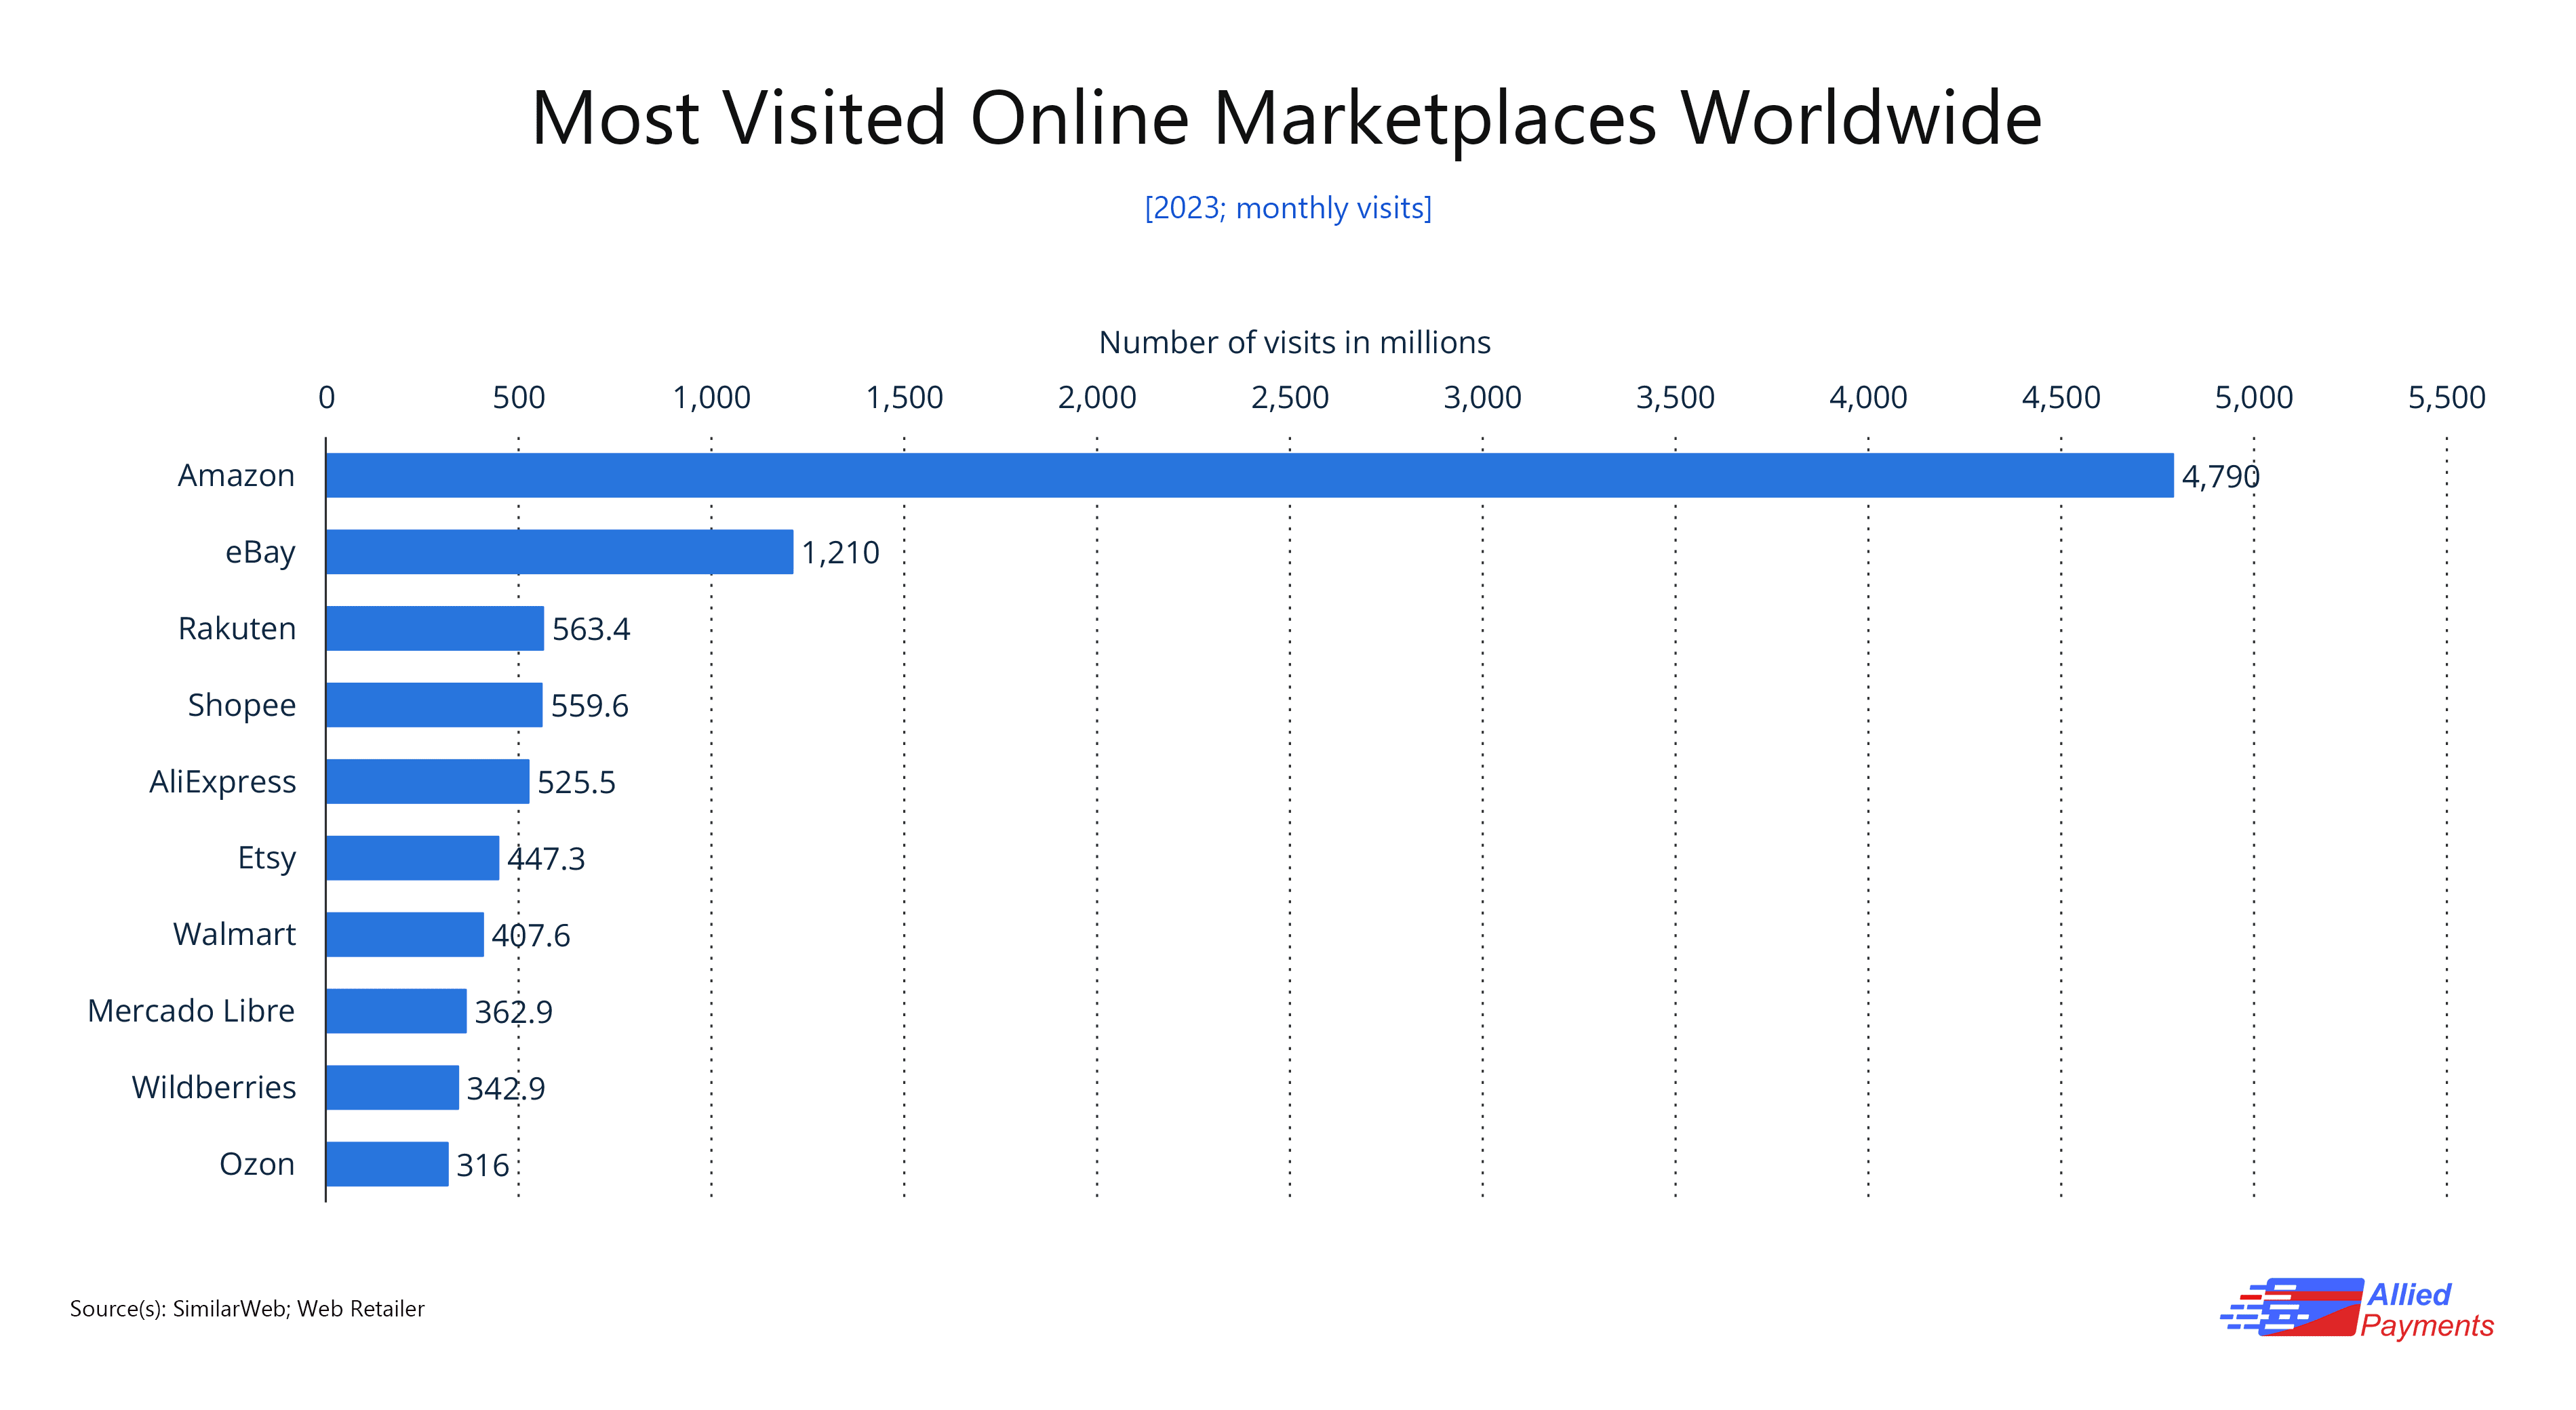
Most Visited Online Marketplaces
July 2022
As of April 2023 the two top retailers in the world based on mobile web traffic were Amazon and eBay. Amazon was the most visited online marketplace with about 4.8 billion visits. eBay clocked in at 2nd with about 1.2 billion visits to their online marketplace.
Notes:
* 2023; Worldwide.
* As of April 2023, Amazon was the most popular online marketplace worldwide, averaging about 4.8 billion visits. eBay was the second most visited marketplace with roughly 1.2 billion visits. Both marketplaces were also the world’s top online retailers in terms of mobile web traffic.
Top Online Food and Beverage Stores’ eCommerce Revenue in the USA
(2021)
In 2022, the leading online store in the Food & Beverage (F&B) market was Walmart.com with net sales of $5.24 billion [USD] followed by HelloFresh.com with $3.59 billion [USD]. Amazon.com was third with $3.12 billion [USD] and Kroger.com was fourth with $2.65 billion [USD] in net sales.

Notes:
* 2021
* Kroger.com was the leading US Food & Beverage marketplace with domestic net sales of $4.571 billion [USD] in 2021. Walmart.com was second with $3.716 billion [USD]. Third and Fourth places were taken by HelloFresh.com ($3.108 billion [USD]) and Amazon.com ($2.957 billion [USD] ) in net sales for 2021.
Top Online Fashion Stores’ eCommerce Revenue in the USA
(2021)
Walmart.com was the leading fashion e-commerce store in 2022 with $9.95 billion [USD] in net sales, followed by Amazon.com with $8.59 billion [USD]. Third place was taken by Macys.com with $6.76 billion [USD] in net sales and Shein.com was 4th with net sales of $5.78 billion [USD] in 2022.

Notes:
* 2021
* Shein.com was the leading US Fashion ecommerce marketplace with domestic net sales of $5.790 billion [USD] in 2021. Macys.com was second with $5.563 billion [USD]. Third and Fourth places were taken by Amazon.com ($5.034 billion [USD]) and Walmart.com ($4.645 billion [USD] ) in net sales for 2021.
Average Revenue per eCommerce User in the USA
(2018-2027)
The Average Revenue per User (ARPU) in the United States is forecasted to increase consistently between 2023 and 2028 by $1,309.8 [USD] or 34.11%. After 9 consecutive years of increases, the indicator is estimated to reach $5,150.32 [USD] and a new peak in 2028.

Notes:
* 2018-2027; United States
* The average revenue per paying ecommerce user in the US between 2023 and 2027 is projected to increase $1,512.20 [USD] or +44.98%. 2027 revenue is expected to reach a new high of $4,883.59 [USD].
Most Popular Categories for Online Purchases in the USA
(2023-2024)
The number of different products and services offered online is constantly growing. Among 7,539 respondents in 2023, the 2 most popular categories for e-commerce purchases were Clothing with 43% of respondents, and Shoes with 33% of respondents.

Notes:
* 2023-2024; United States; 5030 Respondents (ages 18-64)
* The two most popular categories for online purchases of surveyed consumers in the US were Clothing (44%) and Shoes (34%) in 2023.

Online Shopping Statistics
Distribution of Online Purchases
April 2022
Online marketplaces such as eBay, Alibaba.com, or MercadoLibre.com accounted for over 1/3 of global online shopping orders. During a 2023 survey, 15% of digital shoppers reported making e-grocer and supermarket orders online. Brand websites like Puma.com and Adidas.com and came in 3rd with roughly 14% of survey respondents followed by Retailer websites with 13%.

Notes:
* March 25-April 7, 2022; Worldwide; 31,040 Respondents.
* Over 1/3 of online shopping orders occur through Online Marketplaces like eBay, Alibaba and JD.com. In a 2022 survey, 17% of ecommerce shoppers reported making e-grocer and online supermarket purchases. Social on-app purchases were the third most used payment type in 2022 with 14% and Retailer websites rounded out the top four with 12%.
Distribution of Retail Website Visits and Orders
Q1 2023
Mobile phones are responsible for most digital commerce site visits around the world while also creating the largest percentage of orders. As of Q1 of 2023, mobile phones accounted for about 74% of retail site traffic and generated about 63% of online shopping orders.

Notes:
* Q1 2023; Worldwide.
* Mobile phones are the largest source of ecommerce website visits worldwide (74%) and account for 63% of ecommerce orders.
Average Online Spending per eCommerce Shopper
Q1 2023
In Q3 of 2023, online shoppers spent on average $2.30 [USD] per visit across all verticals. Luxury Apparel was the category with the highest spend per visit at $2.71 and Home Furnishing was second with $2.53 [USD] per visit.
Notes:
* Q1 2023; Worldwide
* Online shoppers spent on average $2.30 [USD] per visit across all categories in 2023. The luxury apparel category was the highest spend per visit with $2.71 [USD] and home furniture was second with $2.53 [USD] per visit.
Average Number of Products Bought per Order
January 2022 – December 2022
On average, fewer than 3 products are purchased on every order by e-commerce users. A study from 2022 showed that this number is seasonal, with April and December sales surpassing that market with an average of 3.16 and 3.12 products per order.

Notes:
* 2022; Worldwide
* Online shoppers bought on average just below 3 times per order across all categories in 2023. Purchases correspond to seasonal trends with April (3.16) and December (3.12) being the months with the most items purchased per order.
Shopping Cart Abandonment Rate
2022
In 2022, a significant amount of online shopping orders were abandoned. This means that items were placed into customer shopping carts but the sale was never completed. The industries suffering the highest shopping cart abandonment were cruise and ferry services with a rate of 98%.
Why do Buyers abandon their Shopping Carts?
There are several different reasons why consumers browse and place items in their shopping carts, but do not complete the transaction. Online travel suffers the most from shopping cart abandonment as shoppers search for hotel or airline deals and check back consistently with hopes of finding better prices. This trend has resulted in many online travel agencies beginning to compare prices and inform shoppers based on historical data when they might find the best values and when they should be making reservations to save money. Many times in the US, shopping cart abandonment can be due to larger-than-expected shipping and handling fees, or the need to create an account to checkout the purchase.
The Device Used for Shopping Matters
Mobile users usually have a higher shopping cart abandonment rate than desktop shoppers. In the US, the gap in abandonment rate is over 10% between mobile and desktop uses. The UK has a similar discrepancy between mobile and desktop shoppers, but the shopping cart abandonment rate gap is not quite as wide.

Notes:
* 2022; Worldwide. From 500 global brands.
* In 2022, Travel services experienced Shopping Cart abandonment rates of nearly 98%, the highest non-conversion rate across all industries.
* High Shopping Cart abandonment rates vary by industry; many times it is on account of consumers shopping around for deals and the best prices. This trend has resulted in many online travel agencies providing price comparisons to encourage purchases. In the USA, abandoning shopping carts is also in result of high shipping and handling fees along with the requirement to register an account on the merchant website.
* Mobile users account for a higher percentage of Shopping Cart abandonment rates than desktop users. In the US, the gap between mobile and desktop abandonment rates was more than 10%. The UK has a small gap in their abandonment rates, but mobile was still the leader.
Sources of Online Shopper Purchases
2022
In 2023, online marketplaces were the primary source of inspiration for e-commerce shoppers. According to a survey, 35% of online shoppers reported they used online marketplace searches for inspiration. The 2nd most cited source by 25% of respondents for their e-commerce sales came from in-store shopping.

Notes:
* March 25-April 7, 2022. Worldwide. From 31,040 respondents aged 16 and older shopping at least once per month online.
* In 2023, over 35% of shoppers used marketplaces to inspire their online shopping decisions. In-store shopping was the second most common source of inspiration with nearly 25% of shoppers using that for shopping decisions.
Most Common Devices for Online Purchases in the USA

Most Downloaded Shopping Apps in the USA (2023)
With nearly 123 million downloads in 2023, Temu’s shopping app was the most downloaded e-commerce app in the USA for both iOS and Android. SHEIN was the 2nd most downloaded app with about 21 million downloads on iOS and about 17 million on Android in 2023.

Notes:
* 2023; United States.
* In 2023, Temu’s shopping app was the most downloaded ecommerce app with nearly 123 million downloads combined on iOS and Android. SHEIN was the second most downloaded ecommerce app with nearly 21 million downloads.

Payment Statistics
Market Share of eCommerce Payment Methods
(2022; 2026)
In 2022, mobile wallets were the most popular online payment method, registering nearly half of global e-commerce payment transactions. By 2026, it is expected to increase to 54%. Credit cards rank second with a 20% market share in 2021 and are expected to continue their decline into the coming years.
Digital Mobile Wallets globally
Digital wallet usage varies around the world. In 2020, nearly 60% of e-commerce transactions in Asia were made through a digital wallet. While in Latin America, that number accounted for only about 20% of e-commerce transactions.
UK vs USA
Mobile wallet usage in the UK and USA is popular. The difference between the two countries lies in the way wallets are utilized. In 2020, about 30% of payments in the UK were made using debit cards from their mobile wallets. During that same time in the USA, consumers preferred to use credit cards for mobile wallet purchases.

Notes:
* 2022; Worldwide.
* In 2022, 49% of ecommerce payments worldwide were made through digital wallets. That number is expected to increase to 54% by 2026. Credit cards hold a 20% market share as of 2021, with that number expected to decrease in the future.
* Of note; while mobile wallets are the leading method for buying online, different regions around the world have varying popularity. Asia/Pacific Rim countries use digital wallets for nearly 60% of e-commerce transactions, while Latin American countries use them only about 20% of the time.
* When comparing the US vs UK, digital wallets were favorable to both groups. The main difference lies in the type of cards used, where in 2020 approximately 30% of ecommerce shoppers in the UK used debit cards whereas the majority of online shoppers in the US use credit cards.
Payment Methods as a Percentage of Total eCommerce
(2021)
As of 2022, the usage of digital wallets is significantly higher in Asia-Pacific countries than in other parts of the work. With mobile wallets like AliPay in China and PayTM in India, the popularity is enormous in both online and offline NFC environments. Nearly 70% of e-commerce payments in Asian-Pacific countries occur using digital wallets, compared to about 20% in Latin America, Africa, and the Middle East. Currently, mobile wallets account for less than half of e-commerce payments, but by 2026, that number is expected to reach 54% of total e-commerce transactions.
Wallet Growth in Latin America
The use of wallet apps like Apple Pay and Google Pay in North America doubled between 2020 and 2025, though the market size in Asia will remain significantly larger. According to a regional payments forecast of mobile wallets, Brazil is at the forefront of digital wallet usage in Latin America. This is imparted to the fact that Brazil is home to two of the largest digital wallet systems.
Apple Pay outside the USA
While Apple Pay is popular in the USA, Canada, and the UK, it’s not as dominant beyond those borders. Between 2022 and 2023, about 1 in 10 Brazilians responded to having used Apple Pay in a retail environment, less than the 69% of respondents in the UK who stated they used Apple Pay during that same time. While Apple Pay is used globally, it retains a 9% marketshare in India and 3% in Brazil.

Notes:
* 2021; Worldwide.
* Digital wallet usage is led by the Asia-Pacific region, accounting for nearly 70% of e-commerce payments. Latin America and MEA have the lowest penetration, accounting for approximately 20% of ecommerce payments.
* Globally, digital wallets account for less than half of transactions. By 2026, digital wallets are expected to account for 54% of digital payments.
* Digital wallets (ie; Apple Pay and Google Pay) are expected to double between 2020 and 2025 in North America. Asia will maintain the largest market size while Latin America will experience the highest growth as a percentage of transactions.
* Apple Pay is much more popular in the US, Canada, and UK. Whereas it is not as heavily adopted in Brazil and other countries where it is not as readily offered.
Total PayPal Users Worldwide
(Q1 2010 – Q1 2023)
The number of PayPal users in Q2 of 2023 declined based on the number of active registered accounts. This coincided with a year over year slow down in usage as well. The Daily Active Users (DAU) varied per country with significant differences between countries.
PayPal is a global online payment wallet that allows users to make and receive payments via credit cards, bank transfers, and cryptocurrency. In 2002, eBay acquired PayPal helping establish PayPal as a leader in online and mobile payments. Many retailers today accept PayPal payments due to its wide adoption within the e-commerce industry. In 2015, eBay spun off PayPal as an independent company.
In addition to e-commerce and mobile payments, as of 2018, nearly 36% of brick-and-mortar retailers had already accepted PayPal payments and another 34% were expecting to start accepting payments within the next 24 months. These significant numbers are due to the availability of mobile payments via an NFC device at most credit card terminals. In 2018, mobile payment volume grew 46% year over year to $227 billion [USD].

Notes:
* Q1 2010-Q1 2023; Worldwide.
* Q2 2023 Active Registered Users declined, coinciding with a Year-over-Year slowdown.
* As of December 2018, 36% of North American retail storefronts accepted PayPal and another 34% anticipated adoption within 24 months. $227 million [USD] was being processed through NFC mobile or PayPal card payments in 2018.
Number of PayPal Transactions
(Q1 2014 – Q4 2022)
The number of transactions processed by PayPal worldwide increased by over 10% from Q3 2022 to Q3 2023. PayPal processed roughly 6.2 billion transactions in Q3 2023, up from 5.6 billion transactions in Q3 2022. Though the number of transactions increased, the gross value of payments has continued to decrease over several quarters until 2023.
PayPal profitability in 2023 and beyond
The decrease in payment value and overall profits caused concern among investors, though transaction volume increased. The margin of profit per transaction, known as the take rate, also declined in Q2 of 2023 along with the growth rate of new users, adding to the investor pressure on PayPal management. Increasing competition from fintech companies like Google Pay, Apple Pay, and FedNow along with competition from credit card issuers has given merchants and consumers more choices.
Can Venmo float PayPal?
The PayPal subsidiary Venmo is a popular payment method in the social commerce arena. Venmo is one of the largest social payment processors, but their statistics from Q3 2023 also showed a decline for the first time in 2023. Concerns about competition and integration of alternative payment platforms have put pressure on both the growth and overall usage of Venmo as a P2P payment service.
![]()
Notes:
* Q1 2014-Q4 2022; Worldwide.
* Worldwide payment transactions by PayPal increased nearly 10% in Q4 2022 versus Q2 2022. Approximately 6 billion transactions took place during Q2 2023 versus 5.5 billion in Q2 2022. GPV (Gross Payment Volume) did not increase as much.
Gross Payment Volume of Block (formerly known as Square)
Formerly Square (Q1 2015 – Q4 2022)
In Q3 of 2023, the gross payment volume of Block had grown by 10.5% when compared to Q3 of 2022. While Block’s volume reached a record in Q3 2023, the growth of volume has decreased since 2021. This decrease in growth can be attributed to market saturation or a slowdown in the usage of cryptocurrency, the backbone of Block’s business.
Square: Predominately an American business
Block, the company formerly known as Square (before December 2021), is one of several payment gateway services that make up the $38 billion [USD] market in the United States. Square is primarily focused on US and Canadian merchants. To add to its payment services, Block acquired the Australian Buy Now-Pay Later (BNPL) company Afterpay in January of 2022 for $29 billion [USD].
Block 2024 and beyond
To change the trajectory of Block’s several quarters of negative growth, the company made it a point to refocus its operations. Their goal is to increase their combined gross profit growth and adjusted operating income to achieve at minimum, a positive 40% increase. This would be accomplished by eliminating new hires and possibly reducing headcount moving forward.

Notes:
* Q1 2015-Q2 2022; Worldwide.
* In Q3 2023, GPV (Gross Payment Volume) grew by 10.5%, a deceleration of growth versus Q3 2022.